
Completed: May 2018
I used: Ruby on Rails, C3 Charts, AJAX, Metabase, Python, MySQL
The Labor Department at Berea College sends two annual surveys to the campus. The Labor Experience Evaluation (LEE) asks students to rate their experience in their jobs as part of the work/study agreement and the Student Labor Evaluation (SLE) asks supervisors to rate each student’s performance in their job.
For years, these survey data were automatically plugged into a Microsoft Word template and tens of thousands of pages were printed and distributed around the campus.
In recent years, this was not the case. The PHP script that generated these reports failed once a new question was added to the survey. I was brought in to propose a more future-proof solution.
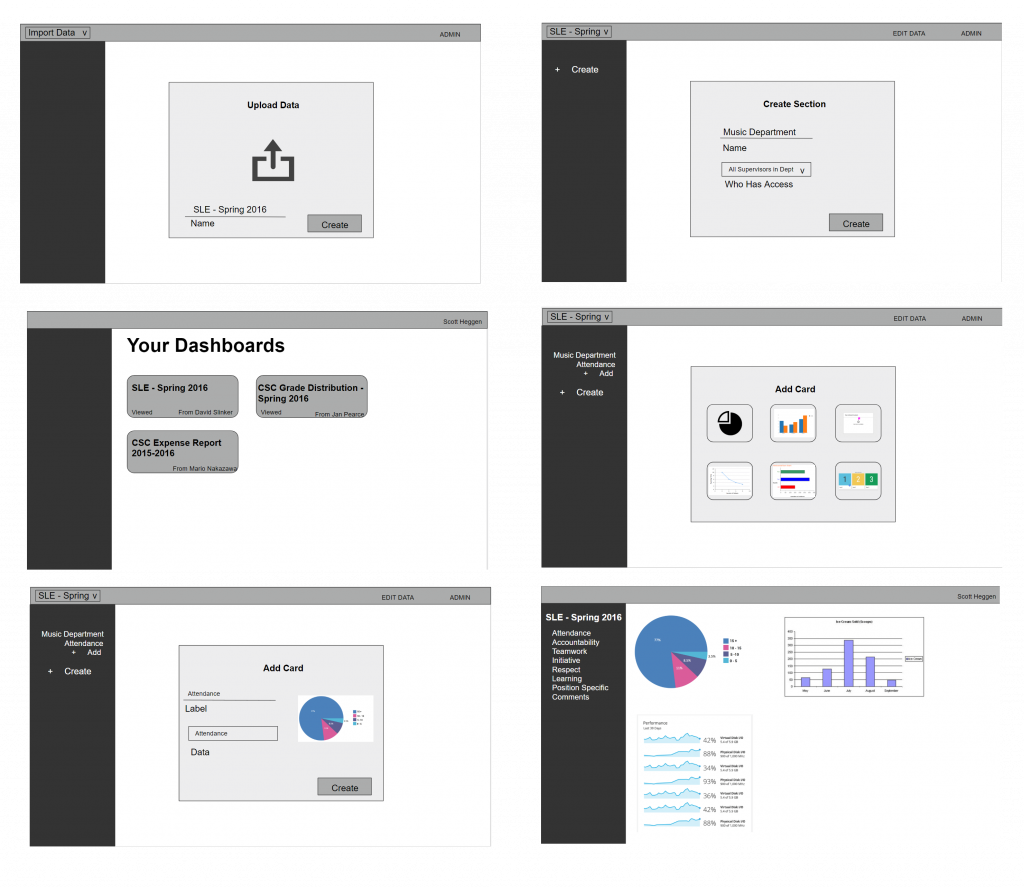
I began work designing the Berea Analytics and Reporting Tool (BART). Bart would save paper by generating online reports. It would be extensible, allowing changes to the data and new insights to be created. Lastly, it would be accessible; anyone should be able to play with the data and share their findings.
I developed a minimum viable product in Rails with all these considerations in mind.
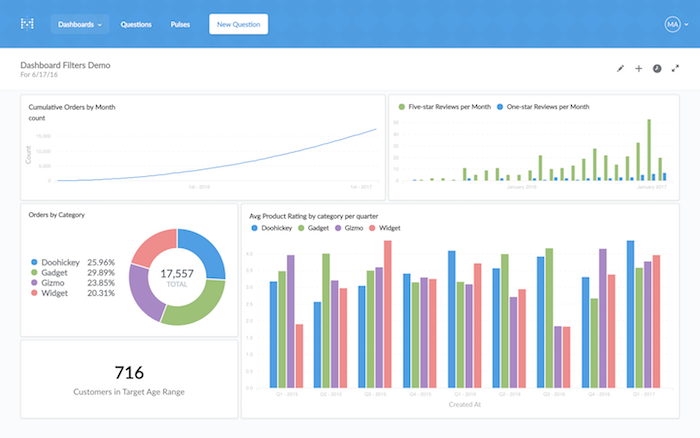
This is the dashboard. Users can view reports organized by sections of cards. A card could display a table, graph, chart, or rich text.
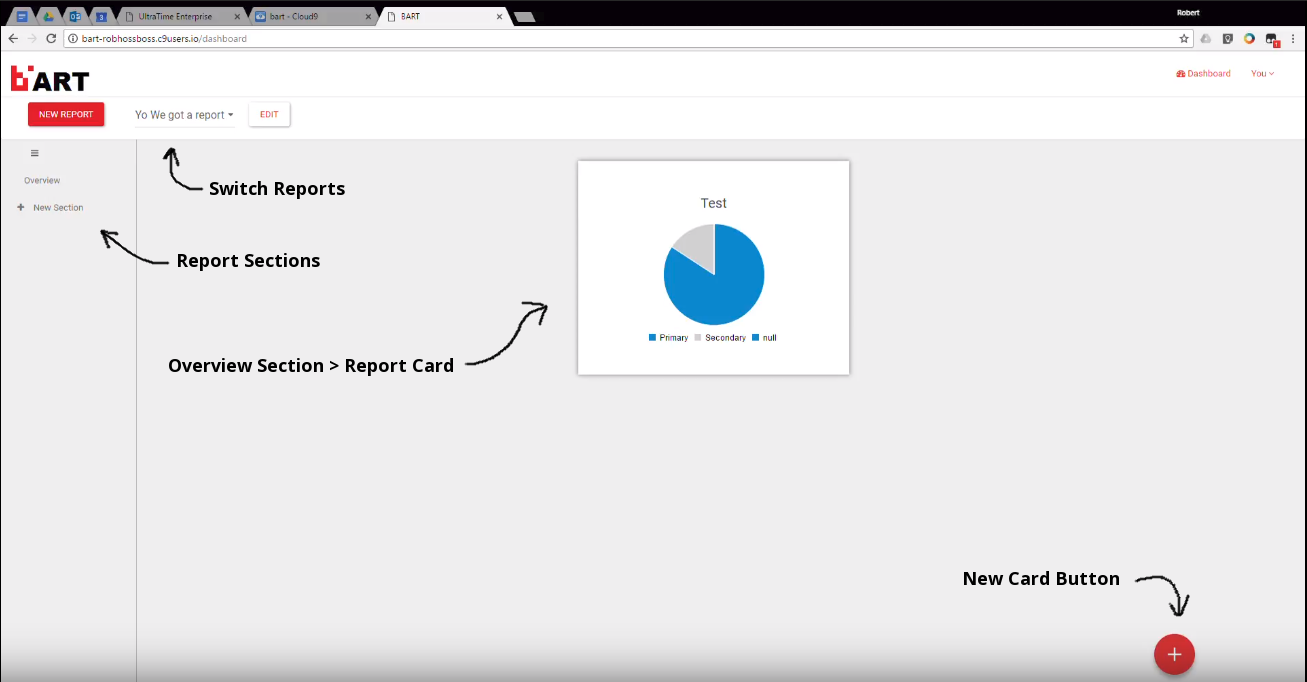
Creating a new card should be easy. The card creation form automatically shows/hides relevant fields based on the input of previous fields. Just right of the form, we see a WYSIWYG preview.
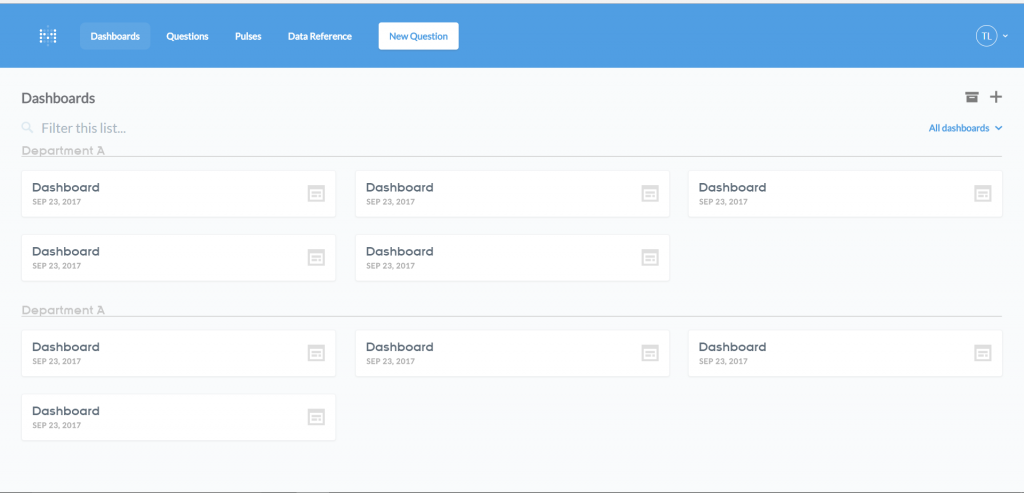
Organizing cards on the dashboard is intuitive. Just drag and drop.
Of course, we can’t expect office administrators to make each report by hand. There should be a way to automate the report generation process.
Just as I was beginning to tackle this issue, I discovered a fantastic open source community working on a project called Metabase.
Metabase was everything I envisioned Bart to be. It even has a similar layout and organization as what I was designing. I made the decision to halt development on Bart and begin incorporating Metabase as the solution to the Labor Department’s problem.
Advantages of using Metabase instead of Bart included:
- Decreased development time by at least 6 months
- Removed the need for continued maintenance of a large codebase
- The added benefit of new features and bug fixes from the open source community
Metabase wouldn’t work for our needs out of the box. At the time, there was no way to do bulk report generation. Luckily, Metabase can be configured to use a MySQL database to represent all its report dashboards and cards. All I needed to do was create one report by hand and replicate the generation of multiple reports by issuing MySQL inserts on the Metabase’s database directly.
I reverse engineered how Metabase stores its reports in MySQL and wrote a Python class to generate reports and assign access permissions from the raw survey data.
In the end, all the Labor Department has to do is run a script once a year and they have beautiful, meaningful, and actionable data about the effectiveness of the labor program.
All the while, significantly less paper is being used, Only basic SQL and Python skills are needed to add a new question or chart to the reports — making it easy for future students to maintain.
Leave a Reply