Skip to content
RH
Portfolio
Logos
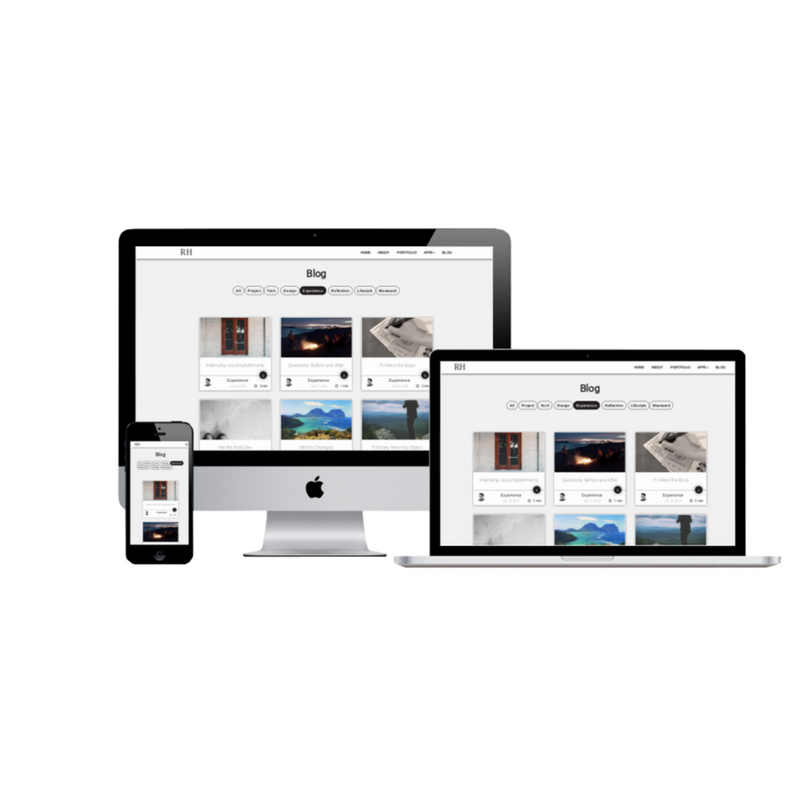
Blog
Portfolio
Admin Tools
– 2025
Wumbo LN Data
– 2023
Data Visualization Tool
– 2019
Forms, Tables, and Reports
– 2019
A.I. User Interface
– 2019
Nuve
Streaming UI
– 2016
Analytics Visualization
– 2016
This Website
– 2016
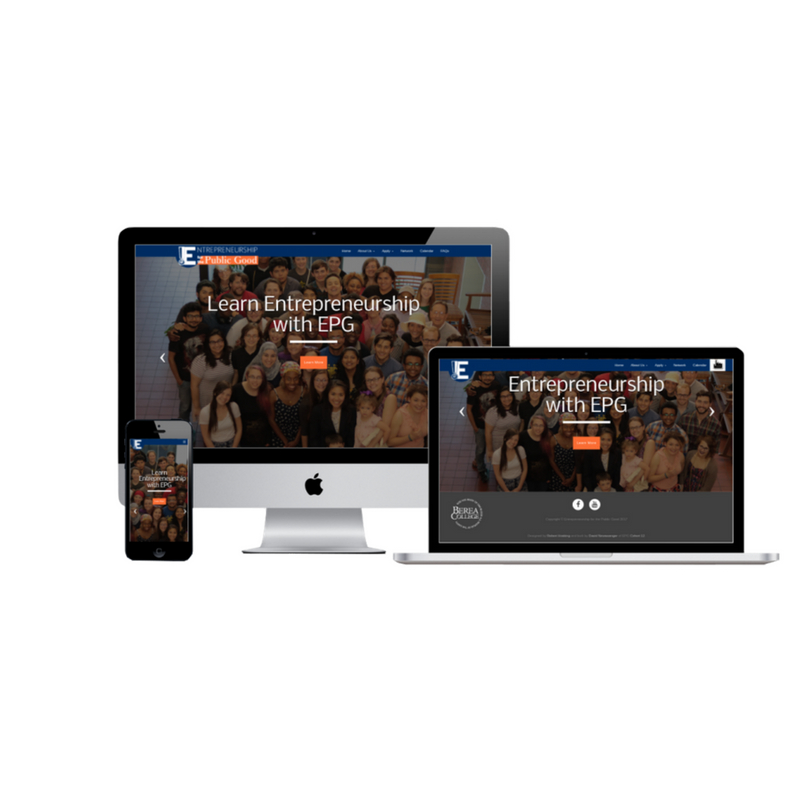
EPG Website
– 2015